|
https://ift.tt/2GYNGi4
Predictive Analytics: How Marketers Can Improve Future Activities https://ift.tt/2GUa7kk
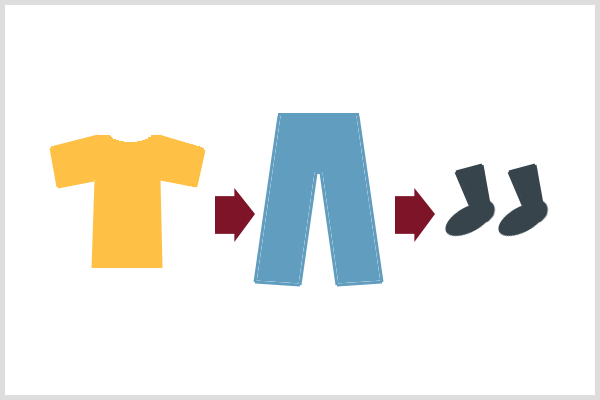
Wondering how predicting your marketing cycles can help? To explore how marketers can get started with predictive analytics, I interview Chris Penn. More About This ShowThe Social Media Marketing podcast is an on-demand talk radio show from Social Media Examiner. It’s designed to help busy marketers, business owners, and creators discover what works with social media marketing. In this episode, I interview Chris Penn, the co-founder and chief innovator at Brain+Trust Insights. He’s also the co-host of the Marketing Over Coffee podcast and the lead analytics expert for Social Media Marketing World. Chris explains how to ensure the quality of underlying data used in predictive analytics. You’ll also discover data sources and tools used to make predictions. Predictive Analytics: How Marketers Can Improve Future Activities featuring insights from Chris Penn on the Social Media Marketing Podcast. Share your feedback, read the show notes, and get the links mentioned in this episode below. Listen NowListen now: Play in new window | Download Subscribe: Apple Podcasts | Android | Google Play | Stitcher | TuneIn | RSS Here are some of the things you’ll discover in this show: Predictive AnalyticsChris’s Story Chris got started in analytics through his background in IT. In 2003, he started working as IT director of a student loan startup, where his role expanded beyond traditional IT responsibilities. In addition to running the web and email servers, he also updated the websites and sent the weekly email. Chris was doing this work before Google Analytics existed, so when the CEO of his company asked how the websites and emails were performing, Chris didn’t have an answer. To figure it out, Chris and his team started developing their own tools to understand the basics, like how many people visited the website each day. Over time, the analytics practice became a core focus for Chris. He was not only trying to learn what happened, but why it happened and how the business could respond. Listen to the show to hear Chris discuss his educational background. What Are Predictive Analytics? Predictive analytics use statistics and machine learning to analyze data and make predictions. Humans are very predictable. We all follow routines, such as brushing our teeth and then taking a shower, or putting on each piece of clothing in a certain order each morning.
Because humans are predictable on both a micro and a macro scale, marketers can mostly predict what will happen. For instance, in North America, if you’re a B2C marketer, you pretty much know that you’re going to be busy from November 1 to December 26 because that’s a peak time for product sales. Similarly, if you’re a B2B marketer, your busy time is January 1 to about the end of May. Then business picks up right after Labor Day in the United States and Canada and continues through U.S. Thanksgiving. Outside of those times, it’s a lot harder to be a marketer, whether you focus on digital, social, or paid. Listen to the show to hear more examples of predictable human behavior. What Can Predictive Analytics Do? Because we know these things generally, machines can help us make these predictions more specific. The value of predictive analytics is their specificity. If you know which week you should do more Facebook Live or spend less on ads, you can be more efficient and effective in your marketing. If you know how to predict, you can make money, save money, save time, and not get fired. Predictive analytics specifically focus on trying to find out what happens next. For the average marketer, time series predictions (or when something is going to happen) are the most conventional and useful application. To illustrate, if you’re a social media marketer, you want to know when to staff up your customer service team to answer customer inquiries.
Predictive analytics can also figure out things like when someone will buy a new car or if they’re expectant parents. However, those applications are more nuanced than time series predictions. Listen to the show to hear about my experiences with predictive analytics when I was a B2B writer. How Predictive Analytics Work Predictive analytics are probably close to 70 years old now. People are surprised to hear how old the discipline is because they think machine learning is something new. However, the theories and mathematical formulas have been around for a really long time. What’s changed is the computational power of laptops, desktops, and cloud servers. They can crunch bigger numbers in a shorter amount of time. Theoretically, you can do predictive analytics on paper, but it would require a lot of paper and time. To do predictive analytics well, you need three aptitudes. First, you need someone with the development skills to extract data from your data sources, such as Google Analytics, Facebook Insights, Twitter, and other kinds of social data. The data may be in systems you own or third-party systems. Whoever has the data, you need to be able to get it out. Chris likes the expression, “Data is the new oil,” because if you’ve ever actually seen crude oil, it’s a disgusting mess. You can’t do much with it until you extract it from the ground, refine it, and then give it to people who can use it in cars or to make plastic bowls that don’t break when they fall on the floor. With predictive analytics, it’s much the same thing.
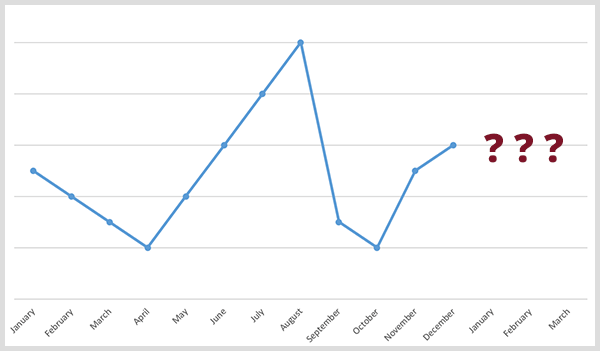
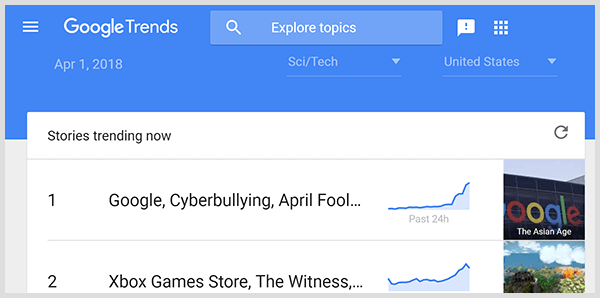
The refiners are data scientists, who clean up the data into something you can use. Then marketing technologists, which is the role of many social media marketers today, do something with that data. They don’t just interpret the data; they act on it. Chris emphasizes the importance of acting on the data you get. If you know what week to promote your event but don’t do anything with that information, then there’s no point in doing the prediction. The accuracy of the predictions depends on the underlying data and the algorithm you use to make the predictions. At some point, almost everyone will run into an issue with data quality. Maybe you didn’t set up Google Analytics right, you didn’t set your goals right, you forgot to turn on your Facebook pixel; any of those things. Listen to the show to hear Chris discuss a popular type of technical stock analysis. Practical Marketing Applications for Predictive Analytics When Chris does a predictive forecast, it typically is a 52-week line graph. For each week, the chart shows a prediction for whatever the data series is. Most of the time, Chris uses search data because people type stuff into Google that they would not tell another human being, making search data a very good indicator of what’s actually on somebody’s mind. A lot of search data is available, and you can access some of it for free through tools like AdWords Keyword Planner or Google Trends. After you have the data, you can forecast a trend of some kind, which is a data series, and then identify the peaks and the valleys. Chris recommends having anywhere from 1 to 5 years of data as the basis for your prediction.
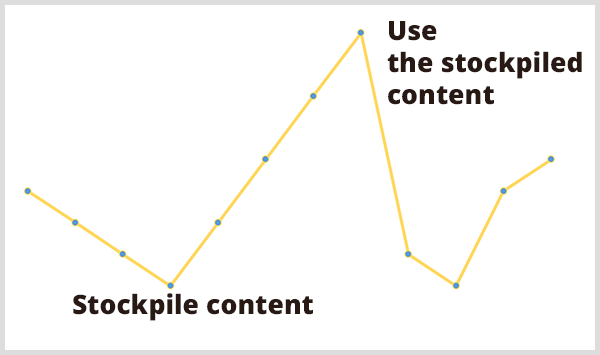
Say you extract 5 years of search data on social media marketing because you’re wondering when in the next year people will be searching for “social media marketing.” If you happen to know that it’s going to be March 20, April 19, May 27, July 4, September 10, and October 21 of this coming year, those are your high-water marks. With those dates, you can also see what happens 2 to 3 weeks before each date. Typically, there’s a run-up to that peak. So a social media marketer needs to crank up their ad spend. An organic marketer needs to post a lot and double the number of Instagram stories they make. A public relations person needs to pitch months in advance to appear in publications on those dates. You also know when the valleys will happen so you can plan to bank content while not much is happening. You might record podcasts, guest host on other sites, write a bunch of blog posts, and stockpile content. Then, when the next peak comes along, you can hit the cadence you need to hit without burning out.
In this way, predictions help you make money on the peaks and save money on the dips. You can plan and build your strategy based on when things are likely to happen. This application works for both B2C and B2B businesses because people type stuff into Google all day, every day. I ask what other data sources you could use to make predictions. Chris says any time-based data source is valid and social media conversations vary on each network. Your Pinterest predictions may be different than your Facebook and Twitter ones. Make predictions based on all of that data. To do that, one really great tool is CrowdTangle. It’s fantastic because it gives you time series data down to the individual post level. A public relations person can pull news mentions and news coverage. An advertiser can pull pay-per-click amounts, bid prices, all of these things. Third-party data sources are good because you as a company can’t corrupt that data, per se, although you can ask for the wrong things. One reputable data vendor is SEMrush, which has good quality data. Another vendor, Brand24, does media monitoring.
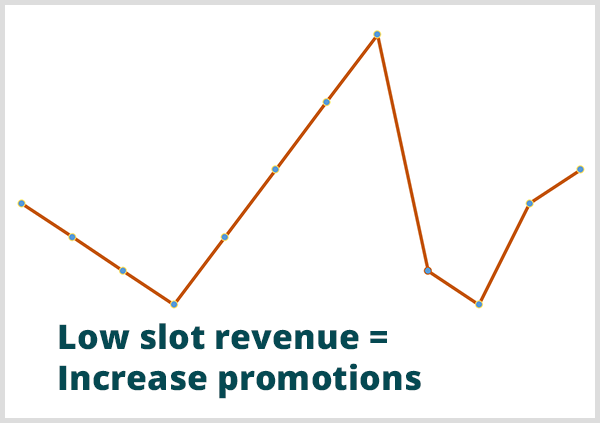
You can also look at search data from SEO tools that aren’t Google’s. Those are all good data sources because they’re consistent, normalized, and regular. Also, they’re reasonably clean. Chris then shares another example of how you can apply predictive analytics to your business. Chris did a predictive run for a casino based on 2 years of daily slot machine revenue. After putting that data into an algorithm, Chris was able to forecast the casino’s revenue for the next year. With these predictions, the casino could see when slot revenue would be low and they needed to crank up some promotions, run ads, bring in a special guest entertainer, or something like that. The data helped them patch those gaps in their revenue.
I ask how marketers avoid impacting the data. Hypothetically, say we gear up our marketing promotions for Social Media Marketing World on certain schedules that aren’t necessarily based on predictions, but ones we decided to use. How do we rule out that the behavior of the tribe and the community isn’t necessarily caused by our actions? Chris says Social Media Marketing World is such a large, successful show, it actually influences when people search for things like “social media marketing.” However, you can refine the data you pull in a few different ways to minimize events, issues, and so on from impacting it. For instance, if you use a social listening tool, you can exclude mentions of Social Media Marketing World, #socialmediaexaminer, Michael Stelzner, and related items. These exclusions help reduce the data points that aren’t supposed to be there. You can also use benchmarking, which establishes a baseline outside of a particular season that adds 20,000 mentions a day. Even in season, is there something that’s disproportionate to what should be there? You can run forecasting that way. However, the best way to refine data is at the data level. Remove stuff that you know is contaminating, for lack of a better word. Then you can forecast from the refined data.
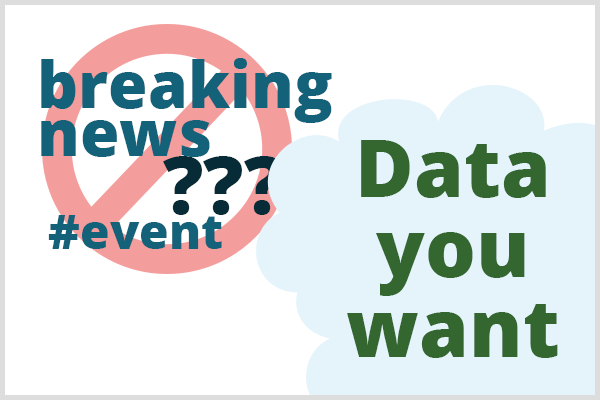
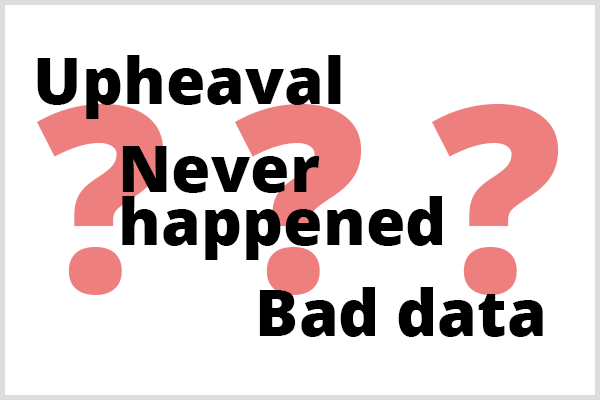
That said, if you were marketing Social Media Marketing World, you wouldn’t necessarily want to refine data in this way. If you’re getting the tribe to influence how people around the world search for “social media marketing,” that’s a good thing. That’s a reason to celebrate your success and try to cause even more behavioral change by getting ahead of trends even earlier. Listen to the show to hear my thoughts on predictable human patterns. What You Can’t Predict Chris says you can’t predict three things. The first is a major upheaval that will distort your data, such as political unrest, cultural upheaval, natural disaster, things like that. All of these things cause major interference that can corrupt a forecast. Sectors with a lot of upheaval, such as the stock market, are nearly impossible to predict with accuracy. The second is something that has never happened, such as the 2016 presidential election. The competition between the two candidates who were running had never happened before. Many people creating predictive tools and forecasts for the election were basing their models on the 2012 election. However, the candidates in each party were very different people between those election years. So the tools that people built for 2016 were based on something that had happened in the past but that was not happening at present. You can’t forecast what has never happened. The third disqualifier for predictive analytics is bad data. If you’ve got corrupted data or no data, you can’t make accurate predictions. If you know your company has data infrastructure problems, predictive analytics is actually dangerous. It would be like driving with a GPS that has bad data and tells you to drive right off a cliff.
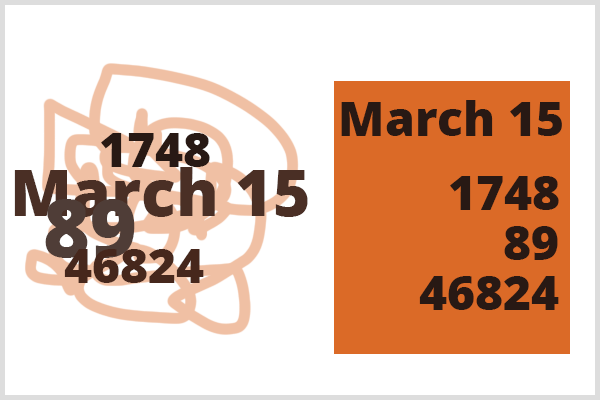
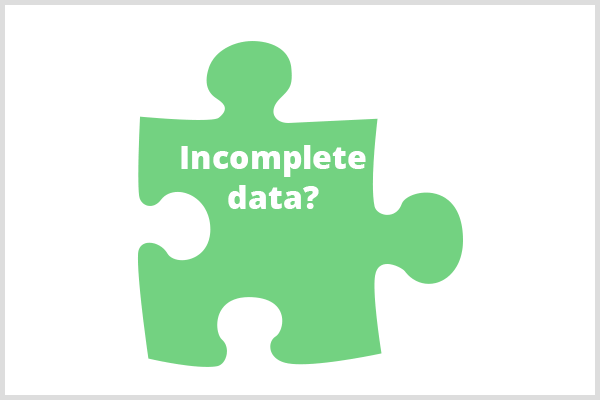
Listen to the show to hear Chris share another term for upheaval. Common Data Problems If you want to try predictive analytics, Google Analytics is a good start. Most marketers certainly have that data, but it can have issues. As an example, if you use marketing automation software, you need to put your Google Analytics tags on your landing pages in that software. If you don’t, you have data integrity problems. I then ask how to handle bots and blockers. Chris says social media, especially Instagram and Twitter, are rife with bots. The good news is that the bot behaviors are fairly predictable because the people who wrote these bots used very primitive algorithms. In the data-preparation process, bots are easy to spot and you can remove them. To illustrate, one bot always has a bio that follows the exact same format. The bio begins with different words that are different lengths followed by “check me out” and then a link. Blockers are significantly harder to work with. If you’re trying to forecast based on ad data, and blockers are removing data, that’s very difficult to fix. The data isn’t wrong; you don’t even have it. It’s incomplete. You can deal with incomplete data in two ways. First, you can look for something that’s directional because the data you have is still representative. Say you know 30% of ads being blocked are happening on a mobile device, but it’s a consistent 30%. You don’t have 22% of ads blocked on one site but 5% on another.
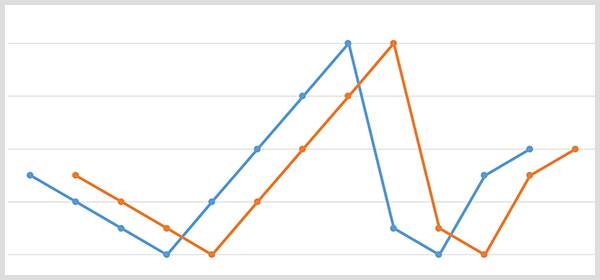
If the blocking is all relatively consistent, then you’ll still be pointed directionally in the right way because over time some ads will perform better or worse. The second option is available only to companies with a massive database, such as big tech companies or data companies. With a large amount of data, you can do imputation, which uses an existing trained data set and machine learning to fill in the incomplete pieces. A really good example of imputation is social shares. In early February, LinkedIn turned off its share numbers, so you no longer get that number from any social media monitoring tool. If Chris were working at a social media monitoring company, he would use the last 10 years of data as a training set and infer the number of shares. You can infer the number of shares as long as you have other parallel data sets, like Twitter and Pinterest. Those share numbers will essentially let a machine fill in the blanks for LinkedIn shares. Listen to the show for my thoughts on bots and blockers. Examples For a well-known office supply company, Chris ran predictive analyses of the brand name and the generic term “office supplies.” Although the brand name and the generic term mirrored each other, “office supplies” was 20 days behind the brand name.
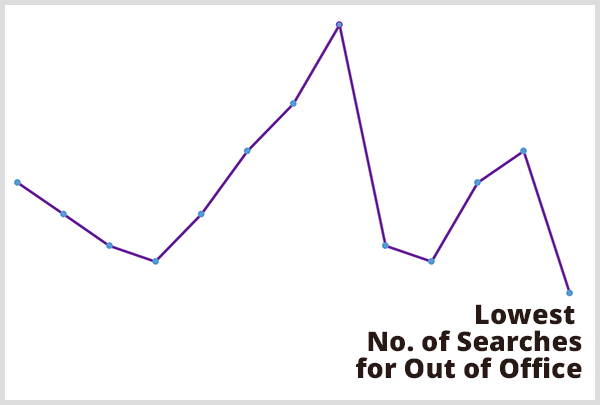
For instance, the brand name had a big spike in late August, which Chris attributed to back-to-school season and people returning to work. But then 20 days later, the search term for “office supplies” followed the exact same spike and the exact same pattern. Whatever is happening there behaviorally, people look for the brand and then 20 days later, search for the generic term. Based on the findings, Chris suggested the company build a retargeting campaign that’s timed at 19 days. Retarget everyone who goes to your website 19 days later with an ad reminding them to come back for more office supplies. With the retargeting ad, the company could recapture some of that demand. In this way, predictive analytics can offer a huge ROI. Someone could assume that everything they’re doing isn’t working anymore and just stop. With predictive analytics, you can see the reality is that your social marketing simply out of sync with customers’ patterns. Next, Chris shares an example from his own business. He was benchmarking based on when people search for Outlook out-of-office settings, because when someone’s looking for that, you know they’re getting ready to go on vacation, which means they’re not reading their email. After running that benchmark in October 2017, Chris projected forward for the first quarter. Chris projected that the search volume was lowest, meaning that most people were in the office, the week of January 18, 2018. On that week, Chris ran the same campaign for his book to the same list and with the same offer as he ran in 2017.
By refining his timing for the 2018 promotion, Chris increased book sales by 40%. His 2017 campaign was off by about 2 weeks, and Chris learned that being out of sync with his audience made a huge difference. I ask how a business that publishes information might use predictive analytics to improve its strategy. For this example, Chris says one of his favorite applications is content strategy. Say you regularly cover certain topics. You can run a whole combination of these predictions. The top-performing 10% can drive your editorial calendar because if you know the months when people will be most interested in a topic, you can plan monthly features around that topic. You’ll even know down to the week when to publish content about a certain topic. In this way, you can hit the high note every month. Predictive analytics can also inform your advertising calendar. If you know you’re publishing on a certain topic, you can set your rate cards based on that topic. For the month you know audience demand for a topic is high, you could charge advertisers that are interested in that topic full price. When you know interest in the advertisers’ target topic is low, you might offer 40% off. Listen to the show to hear Chris discuss how Social Media Examiner might apply predictive analytics to its content. Tools Chris says the best tools are free. They are programming languages (like R and Python), as well as the libraries (like SIDEKIT, NumPy, timetk) that offer code you can use for certain tasks. However, to use these free tools, you need a lot of technical experience. The programming languages and libraries are like engine parts. To get a car, you have to build it yourself.
For the technically capable business of any size, if you have someone or multiple people who can fill the roles of developer, data scientist, and marketing technologist, you can use predictive analytics to create your own forecasts for free. However, if you don’t have the time or knowledge to use these tools but you’ve got money, your best bet is to outsource forecasting. Hire a data science company. If you’re interested in learning how data science works, Chris strongly recommends the blog at KDnuggets.com and the IBM data science blog. The IBM Data Science Experience is excellent as well. You should also follow the developer blogs for the major tech companies such as Microsoft, Amazon, Google, and IBM. However, you find the best information about data science in academic papers. If you can read those papers without falling asleep and extract the information, you’ll find some real gold. You’ll learn techniques that you can try on your data. This predictive algorithm that we’ve been talking about has been around for 70 years. It’s a tool like a spatula. If all you ever do is flip a piece of toast, you’ll have a very expensive toast flipper.
However, if you think about grilling, stir-frying, and all the things that you can do with a spatula, then the possibilities become endless. The same is true of data science tools and algorithms. You can use your creativity and curiosity to try them out in all of these different ways. In the future, using these tools will become as easy as running a Facebook ad because a lot of predictive analytics are already very mechanized. However, the part that involves human judgment and context will take longer to happen. Machines can’t understand how businesses work and therefore can’t see those possibilities. But after you map the grand strategy, you’ll soon be able to click a button, swipe your credit card, pay your $99 monthly fee, and the tool will spit out charts. Chris thinks this capability will be available within the next 5 years. Further down the road, as general-purpose artificial intelligence improves, you might be able to tell a machine you want to optimize your Facebook spend based on demand. Then the machine will automatically do the prediction, figure out when the peaks and the valleys occur, and basically run your budget and ads for you. That’s probably 5 to 10 years out. Listen to the show to hear Chris share more about what machines can’t do. Discovery of the WeekReshot is a stock photo site that avoids cliché stock imagery. The photos on Reshot reflect the photographer’s unique perspective. In this way, the photos are higher quality than those on many other stock photo sites.
The site uses a simple license and terms that give you a lot of flexibility for using the photos. Reshot photos are free, although you can also find photos for sale from Reshot partners. To browse the images or learn more, visit the website. Listen to the show to learn more and let us know how Reshot works for you. Key takeaways mentioned in this episode:What do you think? What are your thoughts on predictive analytics? Please share your comments below.  Social Media via https://ift.tt/1LtH18p April 13, 2018 at 05:01AM
0 Comments
Leave a Reply. |
�
Amazing WeightLossCategories
All
Archives
November 2020
|



 RSS Feed
