
|
http://bit.ly/2VIq9F3
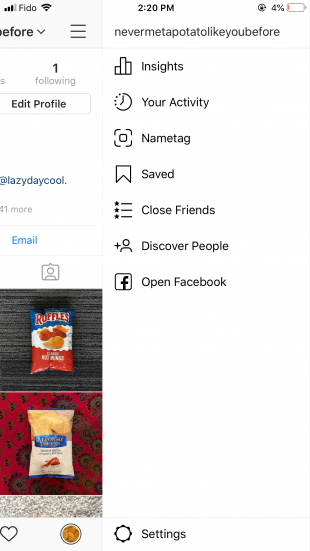
Instagram Stories Analytics: Which Metrics Matter and How to Measure Them http://bit.ly/2IlOhuj Instagram Stories may be ephemeral, but that doesn’t make measuring them any less important. More than 500 million accounts interact with Stories every day, and Instagram Stories analytics provide the tools for brands to understand how followers are engaging with them. There are many brands using Instagram Stories to great effect. In fact, one-third of the most-viewed Stories are from businesses. But the best brands on Instagram Stories aren’t just pointing and shooting; they’re tracking performance and replicating their successes. Make sure you understand how to measure Instagram Stories, and which metrics matter the most when building a strategy for this increasingly popular channel. Download your free pack of 20 customizable Instagram Stories templates now. Save time and look professional while promoting your brand in style. How to use Insights to view your Instagram Stories analyticsInsights on Instagram Stories are available up to 14 days after Stories are published. There are two primary ways to access Instagram Stories insights: From your profile1. Go to your profile. 2. Tap the menu in the upper right corner.
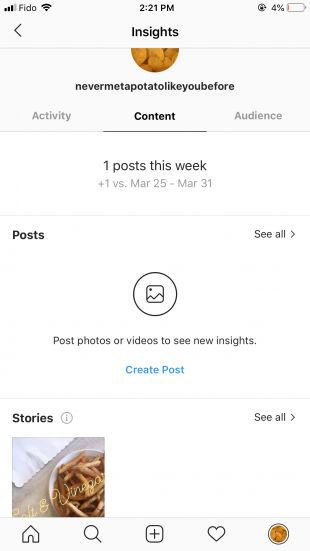
3. Tap Insights. 4. Select Content.
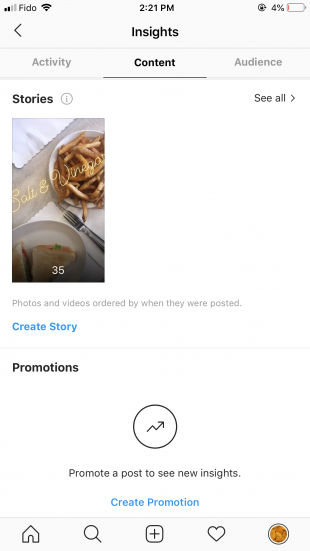
5. Scroll down to Stories.
From your Story1. Click on your Story. 2. Swipe up. 3. Click the graph icon. From here you can toggle between this tab and the views tab, which is labelled with an eye symbol.
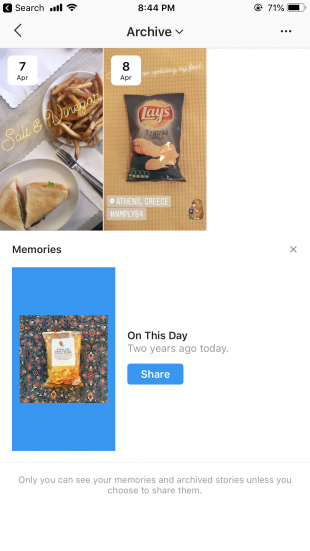
Stories are only available for 24 hours, but you can view them and their insights from your archive. To visit your archive, go to your profile, click the clock icon in the upper left corner, and then select the correct Story.
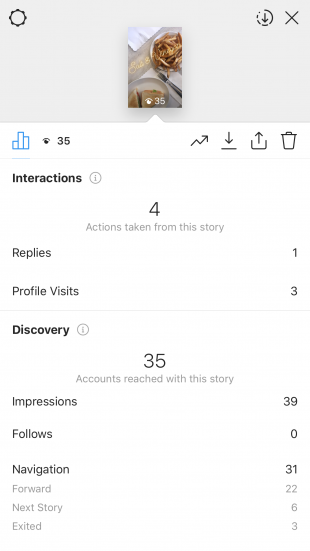
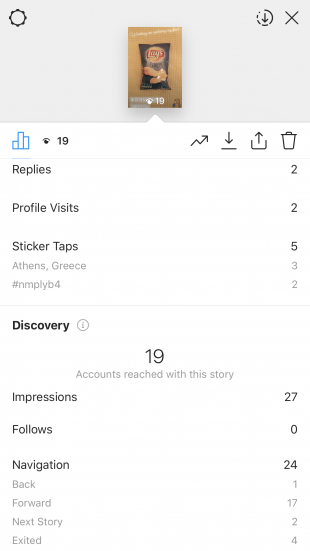
In order to have access to analytics for Instagram Stories, you need to have a business account. Understanding Instagram Stories metricsInstagram Stories analytics are divided into three categories: Interactions, Discovery, and Navigation. Each section offers a summary and a breakdown of different engagements. InteractionsThe interaction metric represents the total actions people take when they see a Story, including replies and profile visits.
Why interaction stats matter: Interaction analytics measure viewer engagement with your Stories. Positive replies and profile visits are a good indicator that viewers like what they see and are keen to share and learn more. Tip: A good way to boost interaction metrics is by sharing a poll, questions, or emoji slider sticker. These stickers offer quick and easy ways for viewers to engage, and also deliver valuable feedback to brands. According to 99 Firms, hashtags can increase Instagram Story engagement by 12 percent. Discovery Discovery measures the number of accounts that view your Instagram Story. Instagram cautions that this metric is an estimate, and may not always be exact.
Why discovery stats matter: Discovery and impression metrics are key to helping you appreciate the scope of your audience. These metrics can be used to calculate the rate of engagement with your Stories content. More importantly, they track how many people are discovering your content. New followers gained through Stories show you how Stories are contributing to brand awareness. Tip: Using stickers can increase the discoverability of Instagram stories. They can help Stories show up in more searches, or be included in larger stories that are curated around certain stickers. Download your free pack of 20 customizable Instagram Stories templates now. Save time and look professional while promoting your brand in style. Download the templates now!
NavigationNavigation stats track the overall completion rate of your Instagram Story. Under Navigation, you’ll see the total number of navigational actions people have taken from your story.
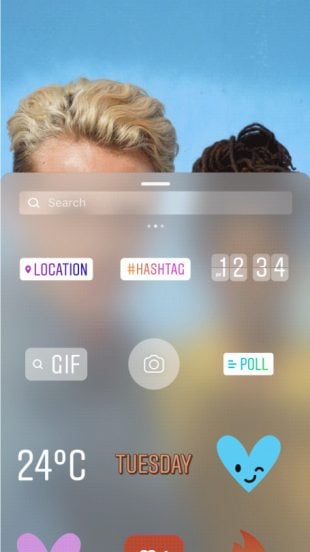
Why navigation stats matter: Like interaction analytics, navigational stats also track actions viewers take, but they tend to be less positive. The more people who forward, exit, and skip your Story for the next one, the more likely it is your content isn’t connecting. If a lot of people are clicking back, it could mean they want another look, or they feel like they missed something. Tip: Including a call to action in your Instagram Stories can help audiences stick with them. Make sure your photos or videos offer viewers enough to engage with. If they can use some assistance, consider adding text or stickers. Find more tips on how to up your Instagram Stories game. More things you can measure with Instagram Stories analyticsHow to measure hashtag and location stickers on Instagram StoriesStickers is the overarching term used to describe the location geotags, hashtags, mentions, and product stickers that can be added to Instagram stories. To measure the effectiveness of stickers, look under the Interactions section in your story insights. If people are tapping on them, they’re probably of interest to your audience.
How to measure engagement on Instagram StoriesThere isn’t a widespread standard for calculating the engagement rate of Instagram Stories, but there are a few ways to track engagement. One way to measure engagement with your Instagram stories in general is to divide reach by number of followers to see what percentage of your followers are viewing your stories. The interactions section is the primary area to look at for engagement with your Instagram stories. Thankfully, Instagram story analytics provides a total tally of all actions taken from a story. That means you can calculate the engagement rate for the story as follows: Total actions / Total reach (Discovery) * 100 How to measure discovery on Instagram StoriesMore than 60 percent of people say they discover a new product on Instagram, and stories play a significant role in fueling that discovery. Impressions and reach are a good way to keep tabs on discovery, but Instagram doesn’t differentiate between accounts that follow you and accounts that don’t. If your total reach exceeds your total follower account, that’s a good indication that your stories are being seen by new users. Perhaps the best gage for discovery is Follows. A Follow from a story typically means that a person is new to your account content and liked what they saw. How to measure Swipe Up on Instagram StoriesBetween 15 and 25 percent of Instagram story viewers will swipe up on a story if the option is available. But, Instagram analytics don’t track link clicks. The best way around this is to use UTM parameters. These short text codes that are added to URLs will allow you to track website visitors and traffic sources. The swipe-up link feature is currently only available to accounts with more than 10K followers. Here are some simple ways to get more followers on Instagram. Save time managing your Instagram presence using Hootsuite. From a single dashboard you can schedule and publish posts directly to Instagram, engage the audience, measure performance, and run all your other social media profiles. Try it free today. The post Instagram Stories Analytics: Which Metrics Matter and How to Measure Them appeared first on Hootsuite Social Media Management. Social Media via Hootsuite Social Media Management http://bit.ly/1LdunxE April 15, 2019 at 09:04AM
0 Comments
Leave a Reply. |
�
Amazing WeightLoss Categories
All
Archives
November 2020
|
 RSS Feed
