
|
http://ift.tt/2nNmDIM
How to Assess Your LinkedIn Company Page Performance http://ift.tt/2oGMwxJ
Are you examining what works for your competitors? Using key metrics to benchmark your LinkedIn company page performance against your competitors’ pages will help you identify your strengths and weaknesses. In this article, you’ll discover how to analyze your LinkedIn efforts and find out what’s working for your competition. How to Assess Your LinkedIn Company Page Performance by Oren Greenberg on Social Media Examiner.
Create an Audit SpreadsheetThe main objective of a LinkedIn audit is to gauge performance. An audit helps you identify which techniques are getting you the best results and which are falling short. If you conduct audits regularly, you can compare your current performance with past efforts to see whether you’ve made progress. Before starting your audit, create a spreadsheet to track your assessments. Here’s a list of columns to include:
Create a spreadsheet to track the data from your LinkedIn company page audit. If you don’t want to create an audit sheet from scratch, you’ll find many free social media audit templates available online. Once you have a spreadsheet for your audit, let’s look at how to find the data you should include. #1: Track Follower DataTo assess your company page, you’ll use LinkedIn’s built-in analytics. To view this data, click View Admin Pages on your LinkedIn page and then click Analytics. First, make a note of your total number of followers. You can find this information in your analytics or simply by looking at your page. This number tells you how many people you’re reaching with your campaigns. If you track this number over time, you can view your follower growth pattern. Add your total number of LinkedIn followers to your audit spreadsheet. Next, look at your follower demographics. This information is divided into five categories: Seniority, Industry, Company Size, Function, and Employee. The graph below shows follower demographics for the Function category. (You have to scroll down a bit on your analytics page to see this graph.) This data helps you determine if you’re attracting your target audience. Add this information to your spreadsheet. Look at your LinkedIn demographics to see if you’re attracting your target audience. #2: Examine Engagement DataNow you want to look at the engagement data for your page and individual updates. Your LinkedIn analytics will show the number of impressions/reach, clicks, likes, comments, shares, and engagement % for a specific time period. Choose the last 30 days as the time period (for now). Audit the different engagements for your page by clicking on them as shown below. The graph displays page engagement data for each day, so you’ll need to manually add up this data and note it on your spreadsheet. Add page engagement numbers to your LinkedIn audit spreadsheet. Next, look at update analytics to view the number of clicks, impressions, and other forms of engagement for individual posts. You can see what type of posts (image, text, etc.) had the highest engagement. Make a note of this information because it indicates which types of posts to share more often. View engagement numbers for individual LinkedIn updates to see which post types get the most engagement. #3: Measure Referral TrafficThe next metric to analyze is referral traffic. You want to find out how much traffic LinkedIn is sending to your site. You can do this in Google Analytics. Go to your website’s Google Analytics dashboard and click Acquisition > Social > Network Referrals. Navigate to Network Referrals in your Google Analytics to find referral traffic from LinkedIn. On the Network Referrals page, you can see the amount of traffic you’re receiving from different social media networks, including LinkedIn. Make a note of your LinkedIn traffic on your spreadsheet. #4: Analyze Your Competitors’ PerformanceNow that you’ve analyzed the metrics for your LinkedIn company page, you’ll want to audit your competitors’ pages to see how you stack up. To do this, you’ll use a third-party analytics tool like Quintly. To analyze LinkedIn pages with Quintly, sign up for a paid account, which you can try for free for 14 days. After you sign up, Quintly asks you to add a profile to analyze. Click Add Your First Profile. Sign up for a Quintly account and then click Add Your First Profile. In the search box that appears, type or paste the LinkedIn company page URL of one of your competitors. Add the LinkedIn company page URL for one of your competitors. Quintly will then list that company page below the text box. Select the page and click Add Selected Profiles. You’re then prompted to add more profiles/pages. When you’re done adding pages, click Finish. On your Quintly dashboard, you can now see the same LinkedIn metrics discussed earlier. First look at the number of followers. In the graph below, you can view the current number of followers as well as the follower growth for the time period you’ve chosen. View LinkedIn follower growth for your competitor in Quintly. Make a note of this information on your current spreadsheet (by creating a new column) or on a new spreadsheet. Also look at other follower-related metrics like follower change rate. To find details about updates, click the Updates tab in the left sidebar. 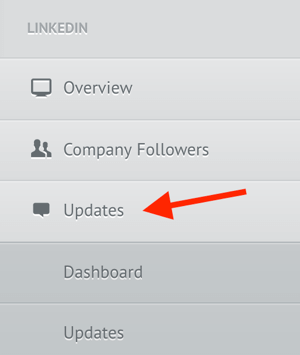
Navigate to Updates in Quintly. You can then view the number of status updates the page posts, the average interactions per update, the best time and day to post an update, and so on. Add this data to your audit spreadsheet. Try similar posting frequencies and timing to see if they work for your page. View your competitor’s LinkedIn Interaction Rate by Update Type in Quintly. In the left sidebar, click the Interactions tab to find out how your competitor’s posts are performing (i.e., how many likes and comments their posts are getting). View the interaction rate, interaction distribution, and interaction rate by update type. Look through the wide range of metrics on your Quintly dashboard and make a note of all relevant data on your spreadsheet. When you’re finished, perform the same audit on other competitors and add the information to your spreadsheet. You can also add your own page URL to Quintly so you can compare your LinkedIn presence to your competitors’. Quintly will display your information along with their data in the same graph (with different colors), as shown in the example below. Compare your LinkedIn data to your competitors’ in Quintly. Use what you learn from the comparison to modify your LinkedIn marketing strategy to reach more people, boost engagement, and drive more traffic. Do a Visual Audit of Your Company Page To do a visual audit of your company page, check to see if you’ve uploaded the right profile picture and cover image, and filled in all of your details (bio, company size, URL, etc.) correctly. Fill in any missing information and make sure everything is up to date. Ford Motor Company’s LinkedIn page includes relevant images and up-to-date details. Conclusion Use the data you collect from your LinkedIn audit to modify your strategy on the network. Stop using methods that aren’t getting results and continue using ones that are. You can also incorporate new tactics or create a new strategy from scratch. Sometimes an audit will indicate LinkedIn isn’t the right network for you and you can redirect your efforts to another social network or platform. What do you think? How do you audit your LinkedIn company page? Do you have any important steps to add to this list? Please leave your comments below. How to Assess Your LinkedIn Company Page Performance by Oren Greenberg on Social Media Examiner. Social Media via http://ift.tt/eZnnjC April 5, 2017 at 10:05PM
0 Comments
Leave a Reply. |
�
Amazing WeightLoss Categories
All
Archives
November 2020
|
 RSS Feed
