
|
Uber Touts COVID-19 Efforts https://ift.tt/37pxfWZ
Uber sent out an email to customers Wednesday touting the actions the ride sharing company has taken to help end the global pandemic. With the headline “We can’t move forward until we can all move forward,” the message communicates the importance of getting vaccinated as soon as possible. “We’ve all been anxiously awaiting progress on the vaccine—hoping that our schools will reopen, our small businesses will begin their recoveries, and we’ll finally be able to hug our loved ones again,” the message reads. “But this won’t happen until everyone has equal access to the vaccine.” Underserved and vulnerable communities face transportation barriers that deny them fair access to the vaccine, according to the company. “Transportation shouldn’t be a barrier to getting access to the COVID-19 vaccine,” the email reads. advertisement advertisement It outlines the moves by the company to that end such as donating 10 million rides for those in need including essential workers, seniors, and underserved communities “Better access for them means better access for all of us,” per the email. Uber has partnered with the National Urban League, National Action Network, the Morehouse School of Medicine, Moderna and Walgreens with the goal of ensuring that vaccine access is more equitable for all. The partnership with Walgreen’s, announced last week, includes several initiatives rolling out over the next few months including free transportation to Walgreens stores and offsite vaccine clinics Pilot transportation programs will begin in cities including Chicago, Atlanta, Houston and El Paso. The initiative includes one-click access to pre-schedule rides on Uber when a Walgreens vaccination appointment is made. New in-app features are being designed to more seamlessly connect active drivers, delivery people, and freight carriers using Uber, Uber Eats, or Uber Freight, with vaccines when they become more readily available. While nearly 80% of the U.S. population lives within five miles of a Walgreens pharmacy, the company has recently expanded different models of care to ensure the delivery of vaccines in underserved and rural areas, such as mobile and off-site clinics. As the vaccine is rolling out nationally, each state, county and even city has different criteria for who can get the vaccine first. Many are now prioritizing restaurant and transportation workers, including drivers and delivery people. Uber continues to enforce a “no mask, no ride” policy to try to keep drivers safe and created a video detailing the effort which has been viewed more than 3.5 million times on YouTube alone. Mobile Marketing via MediaPost.com: mobile https://ift.tt/2oB2PsH February 17, 2021 at 04:46PM
0 Comments
Is That A Couch In Your Pocket, Or Are You Just Glad To Stream Me? https://ift.tt/3dmnVH7 Of all the ethnographic research about how people's media behaviors have changed during the COVID-19 pandemic, I find mobile to be one of the most interesting, and enlightening. Not because it exposed any new epiphany, but because it reaffirms an ongoing development I believe defines mobile as a medium: It's not one. Mobile Marketing via MediaPost.com: mobile https://ift.tt/2oB2PsH February 17, 2021 at 01:15PM
https://ift.tt/37F6I8v
Half Of Mobile Users Are Doing More Streaming Via Phone Since The Pandemic https://ift.tt/3py42zo
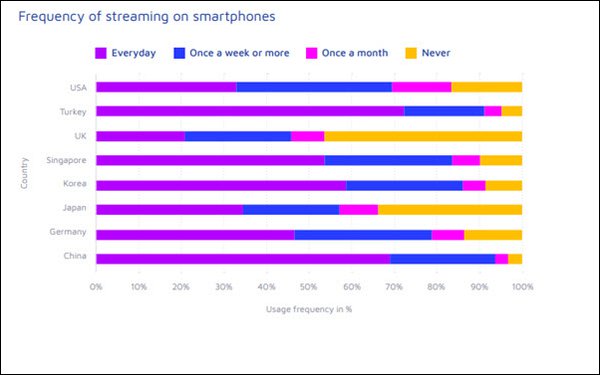
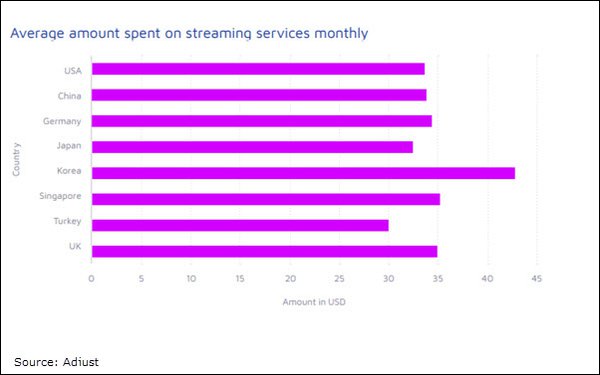
Contrary to the common assumption that most mobile streaming takes place while commuting, a new study finds that of 47% of U.S. mobile phone users are doing more streaming via mobile than before the pandemic and social distancing. About 45% report doing about the same amount of streaming of video and TV content via mobile now, and just 7% say they’re doing this less. The survey, conducted in November by global app marketing analytics platform Adjust, also found that on average, 52.5% of smartphone users across eight countries — the U.S., U.K., Germany, Turkey, Japan, Singapore, Korea, and China — report that they’re using their phones to stream more now than prior to the pandemic. Nearly a third (31.5%) report no change in this behavior. The respondent pool was 8,000 consumers (1,000 per country) age 16 and up, with some questions open only to those who indicated that they use their smartphones to stream. Across the regions, just 12% are streaming less, on average, while four times more are doing more mobile streaming. Since the coronavirus outbreak, consumers are streaming significantly more globally, with U.S. and U.K. users reporting 46.9% and 32.4% increases, respectively. Most users — including 69.4% in the U.S. — report using mobile to stream at least once a day. Users in China (93.8%) and Turkey (91.9%) stream most frequently — every day to once a week — compared to 57.2% for Japan and 45.7% for the U.K. Older generations are also streaming more. Fully 58% of those 55 and older report streaming content at least once a week, and 35% of boomers use their phones to stream every day — although 32% still say they never use phones to stream. Millennials, the biggest mobile streamers, are also watching for the longest periods of time. Their average session length averages just over 94 minutes, closely followed by Gen Z (87.6). Users 55 and older aren’t all that far behind, at 65 minutes. The research finds particularly strong streaming habits across generations in mobile-first countries. Nearly 90% of users aged 55 and older in China (89.8%) and Turkey (88.9%) say they stream via their phone every day or at least more than once a week. APAC — a region that has leapfrogged much of the world in mobile and internet use and penetration — is home to the biggest users of mobile to stream video and TV content. Turkey’s usage levels are twice as high as in the U.K. and nearly 25% higher than in the U.S. U.S. consumers report spending $33.58 per month on average on streaming services — about the same as those in the U.K. ($34.82). Korean consumers spend the most, at $42.68. In the U.S., the TV session average is 108 minutes, compared to 78 minutes for cable. The average session time gap between mobile and TV devices is narrower in mobile-first countries. In Turkey, for instance, the difference is less than 15%, compared to Singapore and Korea, where the difference hovers at 10%. “This drastic shift to routine mobile streaming around the world and across generations has created massive advertising opportunities and a new role for mobile analytics,” said Gijsbert Pols, lead product strategist at Adjust, which is posting the full report on its site. Mobile Marketing via MediaPost.com: mobile https://ift.tt/2oB2PsH February 17, 2021 at 10:15AM 3 Out-of-Home Myths to Overcome for the Rebound https://ift.tt/2OOJc27 As marketers brace for the rebound, the imperative to maximize the value of every ad dollar has elevated the focus on the short term and the role of audience data, targeting and business outcomes across channels. There’s a preconceived notion that out-of-home (OOH) media, while proven as a brand-building channel, has little role to play at the business end of the marketing effectiveness spectrum. That is seen as the territory of performance-based online and social media channels. The perceived wisdom is that as a one-to-many, offline medium, OOH lacks the ability to deeply engage audiences just as much as it lacks data to close the loop between exposure to ads and outcomes. OOH industry insiders know that these perceptions are outdated. Yes, OOH continues to play its historic role as a brand-building and broad audience reach channel. Arguably, this is now even more important for reemerging brands and businesses and there are signs that marketers have already begun shifting investment back towards brand building. advertisement advertisement The celebrated series of Marketing Effectiveness reports by Les Binet and Peter Field, which are based on analysis of hundreds of real campaigns, have proven the preeminence of mass audience reach and long-term brand-building strategies to drive business results, such as growth in market share and profitability. This reinforces the role of channels like OOH as one of the best ways for marketers to drive profitable communications with audiences. However, the OOH industry’s pre-pandemic investments in data, digital screens, and automated trading technologies have also created new roles for OOH across the customer journey and more actionable measurement of audiences and outcomes. Digitization allows for more tactical, responsive, and measurable forms of OOH advertising that are more attuned to the needs of performance marketers and short-term goals. 2020 was an unpredictable year but the outlook for 2021 is becoming clearer. According to Geopath’s most recent mobility report, U.S. traffic has recovered to roughly 90% of what it was pre-COVID. Seventy-five percent of people are taking a trip daily and are traveling an average of 16 miles a day. As a result, OOH is poised for a sharp rebound. WARC’s global report forecasts that OOH will be the second-fastest growing medium year-over-year. We learned a lot last year and we will continue learning and adapting in the year ahead. In this spirit, we took the pulse of brands and agencies to uncover their perceptions and priorities in our latest survey with research provider BWG. Our research demonstrated how myths surrounding OOH advertising continue to shape perceptions of the channel. Here are the three dominant myths surrounding OOH advertising and how marketers can navigate them in 2021: Myth 1: OOH requires a lot of manual effort to plan and manage effectively Our survey revealed that many brands and agencies often choose to manage OOH internally because it allows them to maintain control of media strategy and execution. That said, their biggest pain point with OOH is the manual effort and resources required to deploy effective campaigns on their own. This is not surprising. OOH remains a complex and fragmented medium. That’s why it’s vital to make investments in both talent and technology. Expert OOH teams exist to overcome the complexities and deliver value for marketers. But nowadays, audience and campaign planning tools designed specifically for OOH are essential for expert teams to operate at scale. These tools standardize information about OOH advertising inventory, simplify the campaign planning and buying process and leverage data-driven insights to reach the right audiences and deliver the right outcomes. Digital OOH (DOOH) adoption is accelerating quickly and will play an even larger role within OOH advertising. According to our survey, agencies plan to spend 65% of their OOH budgets on DOOH. To simplify campaign planning, buying and management across both OOH and DOOH, marketers should partner with expert teams and specialized technology platforms that streamline manual processes and apply cutting-edge planning, targeting, and measurement techniques to drive campaign success. Myth 2: There’s a lack of visibility on pricing norms in OOH Many marketers worry they are not paying competitive rates for OOH, they lack visibility into pricing norms, or they don’t have the leverage to negotiate preferred pricing. Pricing transparency ranked as the top priority for agencies and fourth for brands in our survey. One practice that obscures pricing norms for marketers is media buyers including their fees in media costs. This fee model offers simplicity but the downside for marketers is it makes it difficult to know how much of their budget is really spent on working media. Non-transparent models can sometimes lead to misaligned incentives for marketers and their providers. Our survey showed that marketers want greater assurances that media partners and placements are selected first and foremost because they drive campaign effectiveness. A lack of pricing transparency is not endemic to any media channel and all parties in the chain take responsibility for creating a transparent and open system. Agency earnings should be directly linked to value creation within trusted partner relationships. Marketers should align themselves with agencies that operate with transparency as a guiding principle. Myth 3: OOH is difficult to target and measure While performance measurement ranked as the third priority for brands and fifth for agencies in our survey, many are still unfamiliar with OOH targeting, measurement and attribution capabilities due to the disparate datasets and methodologies available. Audience targeting capabilities ranked as the number one priority for brands and number two for agencies in our survey. Brand and agencies can now access intelligent OOH audience targeting tools, which are designed to make it easier than ever to reach the right audiences. These tools gather audience insights based on people’s recent real-world, observed behaviors — rather than purely historic socio-demographic data. By leveraging new forms of behavioral data, marketers can be more precise with their targeting and messaging. Measuring campaign effectiveness is usually one of the first things marketers consider when developing cross-channel media strategy, but with OOH it is too often an afterthought. There is no reason for marketing effectiveness to work differently in OOH than any other channel. The same behavioral data used for audience targeting can also be used to detect real-world exposure to OOH advertising messages and close the loop on campaign outcomes. A well-planned measurement strategy allows marketers to truly understand efficacy of their OOH investment and to uncover new insights to fuel future strategy. OOH as a brand marketing channel has been transformed by data and digital technologies to deliver more precise and targeted campaigns that are better attuned to drive short-term business outcomes. To overcome the outdated myths surrounding manual effort, pricing transparency and measurement, marketers should partner with expert teams with specialized technologies to simplify the process and unlock the full potential of OOH.
Mobile Marketing via MediaPost.com: mobile https://ift.tt/2oB2PsH February 17, 2021 at 10:15AM Taboola Uses AI, Deep Learning To Build Personalized Loyalty Segments For Publishers https://ift.tt/3dqliUP Taboola on Monday introduced a set of loyalty features for publishers as part of its personalization and segmentation suite. The feature, which uses artificial intelligence and deep learning to identify loyal site visitors, is built on a loyalty score. The score is based on understanding the number of times readers visit a site, how long they stay, how many pages they view and the recency of their visits. Based on the criteria, readers are segmented and receive a loyalty score. For example, if one set of site visitors has an average of 10 page views in one week earlier in the month versus another set that had 10 page views last week, the latter group would get a higher loyalty score based on their recency. One large unnamed U.S. news publication has already achieved an 18% desktop and 10% mobile RPM increase by adjusting their site content shown to flyby readers. The score also factors in whether the site visitor originated from a search engine, social site, or typed the publisher’s URL directly into the browser. Readers who come directly to publisher site by typing in their URL, rather than searching in—Google, Bing, or Facebook—tend to have a higher loyalty toward the publisher, compared with people coming from social media. advertisement advertisement Publishers using Taboola to deliver the ideal reader experience for each reader segment aims to promote increased readership and unlock new opportunities. This new way for publisher to segment readers based on their loyalty toward the site also lets publishers identify readers who likely won’t return. Segments include flyby readers, groups that visit less frequently and consume the least amount of pages; loyal readers, groups that demonstrate site affinity and consume the most amount of page views; and casual readers, those who fall between. Publishers can personalize the reader experience based on these loyalty levels, to optimize user engagement and monetization, based on what makes most sense for each segment. This may include adjusting the ratio of publishers’ own content versus advertising content, enabling loyal readers to engage with more publisher content; or surfacing abridged articles that feature a “Read More” button, targeted only to flyby users. The feature also provides the ability to provide special offers only to loyal readers to subscribe to content or sign up to newsletters. The same webpage real estate can then be utilized for other purposes for other less loyal reader segments. Site visitors using apps are in a separate category, but Taboola treats mobile app visitors as "high-loyalty" readers since they have already shown strong familiarity with the publisher's brand by searching for the app in an app store, downloading the app, in some cases logging in with social profiles.
Mobile Marketing via MediaPost.com: mobile https://ift.tt/2oB2PsH February 17, 2021 at 09:30AM
https://ift.tt/3dsaTrX
Roku To Produce Original Shows, Films https://ift.tt/3s0sKdf
With aggressive advertising growth a core part of its strategy, Roku appears to be jumping feet first into the content business. Having acquired exclusive rights to the content library of defunct streamer Quibi in last month for its ad-supported Roku Channel, Roku looks to be preparing to produce its own original shows and films. The company last month began running an ad (above) on LinkedIn for “a lead production attorney for Roku's original episodic and feature length productions," reports Protocol. The ad referred to “building an expanding slate of original content,” and described the job as including interaction with guilds and unions, working on "option purchase agreements, script acquisition agreements, life rights agreements, agreements to hire writers, actors, directors and individual producers, production services agreements, below-the-line agreements including for department heads, location agreements, clearances, prop rental agreements, likeness releases and credit memos.” LinkedIn now shows the job having been filled Roku, which is set to report Q4 and full-year earnings on Thursday, declined to comment on the report. In reporting Q3 earnings last November, Roku said that its services business, which comprises mainly ad revenue, had generated more than $1 billion on a 12-month trailing basis by the end of September, Protocol notes. While it did not specifically break out advertising revenue, Roku reported that 97% of TV advertisers that spent $1 million or more or more with the company in Q3 2019 continued to invest in Q3 2020. First-time advertisers more than doubled, largely coming from marketers using Roku’s OneView ad platform, which allows advertisers to buy media against performance guarantees based on business outcomes such as website visits or mobile app downloads. In total, Roku offers advertisers reach to 51.2 million active accounts, and 54% of its users are not pay-TV subscribers, according to the company’s site. In Q2 2020, analyst projections put Roku’s ad revenue at $116 million, or 32% of the company’s total revenue of $356.1 million for the quarter. MoffettNathanson Research projected Roku’s 2020 video advertising revenue at $566 million, rising to $902 million in 2021. Mobile Marketing via MediaPost.com: mobile https://ift.tt/2oB2PsH February 17, 2021 at 06:52AM
https://ift.tt/3puP790
Why Influencer Marketing Should Be a Priority 2021 Tactic for B2B Brands https://ift.tt/37ngKuD The post Why Influencer Marketing Should Be a Priority 2021 Tactic for B2B Brands appeared first on B2B Marketing Blog - TopRank®. Mobile Marketing,SEO via Hubspot https://ift.tt/2wiHYzh February 17, 2021 at 05:37AM YouTube Reveals Product Roadmap For 2021, From Commerce To TV https://ift.tt/2LWjGH4 YouTube continues to build out a suite of ways to monetize commerce across the video site. Tests are underway to integrate shopping experience that allows viewers to tap into the credibility and the knowledge of creators they trust before making informed purchases directly on YouTube. Mobile Marketing via MediaPost.com: mobile https://ift.tt/2oB2PsH February 16, 2021 at 07:59PM Game Playing: Customer Service Lags At Gaming Firms https://ift.tt/3bgIsKy Games are supposed to be fun. But many players face an aggravating experience, judging by Customer Service Benchmark Report, a study by Netomi finds. The digital support channel of choice for game enthusiasts is email. But only 54% of companies have a readily accessible email address. And of those that do provide a convenient email address,76% ignore customer service emails. And almost 33% fail to provide a meaningful response. On the Support Performance Index (SPI), which ranges on a scale of 1 to 100, the average for the gaming business is 51.17%. The average amount of time it takes to answer is 39 hours. But it varies by region. On a global basis, firms in the Asia-Pacific region score an SPI of 56.2 — and the average response time is 10.3 hours. Next is North America, which has an SPI of 52.68 — with a response time of 29.6 hours. It gets worse in the Europe, Africa and Middle East region, where the response averages 2.4 days and the SPI is 48.59. And in Latin America, there is an SPI of 48.27 and a reply time of 32.2 hours. advertisement advertisement Service also depends on thee channel. Mobile gaming companies have an average response time of 1.1 days, while for VR/AR firms it is 1.6 days, with PC gaming outfits at 1.9 days, social gaming providers at 2.9 days and console game purveyors at 3.9 days. On the positive side, 80.5% of gaming companies personalize emails, and 52% fully do so. Of those polled, 15.5% extend personal greetings only, and 51.5% provide personal greetings and sign-off. Another 13.5% offer only personal sign-off. But only 6% of gaming firms are fully empathetic. Netomi asked recommendations for a child's social distancing during the pandemic. A mere 7% acknowledged the COVID-19 pandemic, while 50% asked about the child’s interest. Netomi surveyed 2,991 gaming companies in 75 countries. Mobile Marketing via MediaPost.com: mobile https://ift.tt/2oB2PsH February 16, 2021 at 05:13PM Apple TV+ 'Beating' Disney+ In Growth Rate Among Affluent Millennials https://ift.tt/2ZmoEzX
As of February 2020, Bloomberg reported knowledgeable sources saying the streaming service — launched, like Disney+, in November 2019 — had just 10 million subscribers as of February 2020. (They also said that only about half were actively using the service.) Ampere Analytics’ (admittedly rough) estimate put the streamer’s total “subscribers” at 33.6 million at the end of 2019. Statista cites an estimate putting the total at about 40 million by end of 2020. Meanwhile, Wedbush analyst Daniel Ives estimated 30 to 40 million back in April 2020. None of those numbers speaks to the core issue — at least for comparison purposes with other streamers — of how many of Apple TV+’s users are actually paying the modest $4.99 per month subscription price. But as we do know, Apple has been tying a free one-year subscription to the purchase of its iOS devices since TV+’s launch. Which is why Ampere reported that the “vast majority” of the guesstimated 36 million signups as of end of 2019 were unpaid. The “vast majority” assumption continues to be a solid one. After all, Apple has now extended the free “one-year” offer twice —presumably to avoid a plummet in the number of active users, particularly now that it’s promoting its new bundled-services Apple One packages designed to keep consumers tied to the Apple ecosystem of services and devices. Apple TV+ and Apple One are mutually beneficial. I offer all of that as a backdrop, because comparing Apple TV+ to any other streaming service on a “subscriber” basis really isn’t possible. However, Acxiom has drawn an interesting comparison between Apple TV+ and Disney+ in a new analysis based on two statistically representative surveys of 10,000 U.S. adults it conducted in May and Fall 2020 (Oct.14 - Nov. 21) to probe the pandemic’s effects on consumer behavior. Perhaps not very surprisingly, Acxiom’s research found that the overall percentage of consumers who reported subscribing to Disney+ jumped from 23% in May to 31% in November across demographics, while those reporting subscribing to Apple TV+ stayed largely unchanged (8% to 9%). (Again, many/most of the Apple “subscriptions” are no doubt unpaid. But it’s only fair to point out that unknown but large numbers of Disney+ users are also on free deals tied to Verizon Wireless plans. And other free Disney+ deals, like one through U.S. Mobile, are also out there.) Here’s the interesting part: When Acxiom looked at the data more closely, using its consumer segmentation system, it found that high-income Millennials have been adopting Apple TV+ at a much faster rate than Disney+ during the pandemic. Those reporting having Apple TV+ subscriptions nearly doubled, from 6.8% to 12.6%, between May and November. “This suggests that Disney+, while still very popular, may be reaching maximum penetration among certain demographics like high-income millennials,” which could create an opportunity for Apple TV+ and other services “to capture the attention of those who have opted not to subscribe to Disney+, but who may still have an appetite for additional subscriptions,” says Acxiom. With Apple TV+’s most recent extension of its free trial period until June 2021, “the company has a window to capture audience loyalty,” ventures the report. “And living up to its full potential will require strategic investments in quality, popular content – a strategy that has paid dividends for Disney+ over the last year.” While Apple lacks a content archive, it reportedly invested $6 billion in its initial content lineup, and the mega-company has since released a series of high-profile original titles (including the Tom Hanks vehicle “Greyhound”), has signed a first-look deal with Martin Scorsese, and has projects in the pipeline with Steven Spielberg, Oprah, Julia Louis-Dreyfus and others. Apple wouldn’t be spending that kind of money if building a loyal base of users for Apple TV+ weren’t critical to its grand strategy—and rapid adoption by wealthy Millennials can’t be a bad thing. But while it will need to compete for consumers’ time, especially initially, it’s debatable how much it will need to compete against other streamers for their money, at least in a head-to-head sense. How many currently nonpaid Apple TV+ users will convert to paying $4.99 per month for a subscription? I doubt that we’ll ever know. And given its unique position in comparison with other companies with streamers, I doubt that Apple is too worried about that number. From Apple’s standpoint, paid solo subscribers are but one small piece of a puzzle that includes complex calculations of how much Apple TV+ (and other Apple services) contributes to attracting and maintaining Apple One bundle customers and keeping a maximum number of consumers buying and using Apple services and devices throughout their lives. Mobile Marketing via MediaPost.com: mobile https://ift.tt/2oB2PsH February 16, 2021 at 11:31AM |
CategoriesArchives
April 2023
|


 RSS Feed
