
|
https://ift.tt/2PUWtRO
How to Create Customized Reports in Facebook Ads Manager https://ift.tt/2zpIXQN
In this article, you’ll discover how to set up a Facebook Ads Manager report that quickly reveals which ads are working well and which you need to adjust. Why On-Going Analysis of Your Facebook Campaigns Is ImportantOne common mistake that advertisers make is launching a Facebook campaign and doing no analysis while it’s running. It’s the analysis of your campaigns and the subsequent actions you take based on your findings that deliver exceptional return on ad spend (ROAS). 
How to Create Customized Reports in Facebook Ads Manager by Charlie Lawrance on Social Media Examiner.
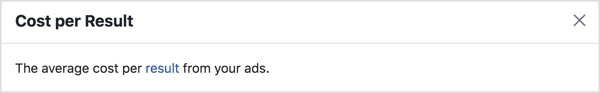
By analyzing your campaign performance on a consistent basis, you’ll be able to quickly spot fluctuations in campaign metrics that signal a need for testing refreshes or reveal winning Facebook ads you should scale. #1: Understand What 4 Core Metrics Mean for Facebook Ads AnalysisAnalyzing four core metrics — cost, relevance, frequency, and CPM — helps you identify and assess the performance of your campaigns and the ads within them. Let’s look at each core metric in turn. Cost per ResultThe first metric to look at is cost per result. The cost metric isn’t your overall spend or amount spent on each of your campaigns; it’s your cost per result based on your campaign objective and ad set optimization. If you’ve set a daily budget and aren’t scaling your campaigns, and you see your cost per result decreasing, your campaign results will be increasing.
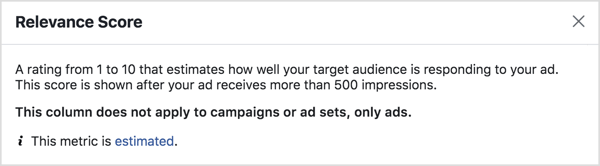
Suppose you’re running a conversion campaign optimizing for Add to Cart actions and targeting your website traffic. If you see the cost per Add to Cart decrease and the number of Add to Cart actions increase, you’re driving more clicks and sales from your website. The opposite is true if your cost per result is increasing. Your campaign is decreasing in performance and you’ll be getting fewer results for your budget. Relevance ScoreThe next metric to look at is relevance. A relevance score is a rating from 1–10 that Facebook gives to each of your ads. This score reflects the ad-to-audience fit and how well people are responding to your ad. This metric can be viewed only at the ad level of your campaigns.
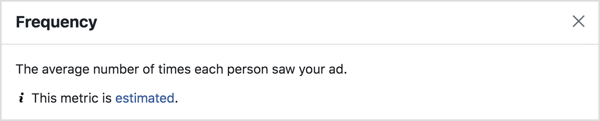
After 500 impressions, your Facebook ads will get an initial relevance score. However, this score will usually change, either increasing or decreasing in the first 72 hours as your campaign embeds in the algorithm. If your relevance score increases over time, you’ll typically see your cost per result decrease and your campaign performance rise. On the flipside, when your relevance score is decreasing, you’ll find your cost per result increasing, indicating your campaign performance is decreasing. FrequencyThe third metric to look at is frequency. Frequency is a delivery metric that tells you how many times on average someone has seen your ad. Your frequency will always start at 1 and increase over time as you spend more of your campaign budget and reach more of your target audience.
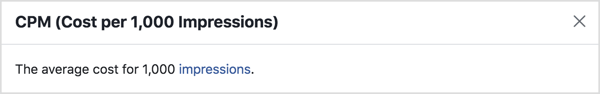
As your frequency increases to 2, 3, 4, 5, and so on, you’ll notice that it impacts your cost per result and relevance score. The higher your frequency, the more people are seeing the same Facebook ads. Eventually, you’ll hit what’s known as ad fatigue. Your relevance score will start to decrease and your cost per result will start to increase. Overall, your campaign performance will be decreasing, and that will have a negative effect on your ROAS. CPMFinally, look at CPM, which is an acronym for cost per mille. This is your cost per 1,000 impressions. As your frequency increases and you reach more of your target audience, your CPM will start to increase. This means that it’s now costing you more for 1,000 impressions than it previously did. This will have an effect on the cost, relevance, and frequency metrics.
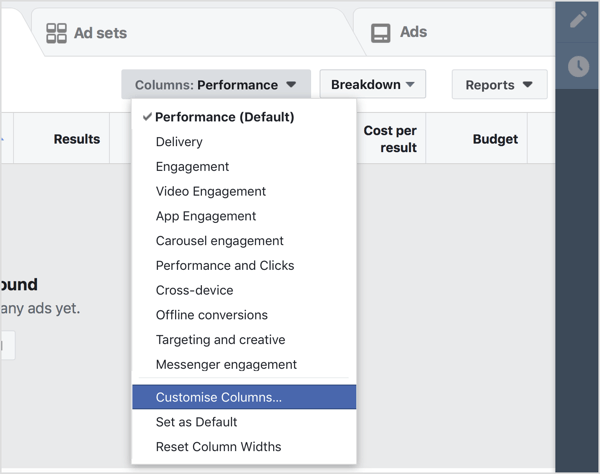
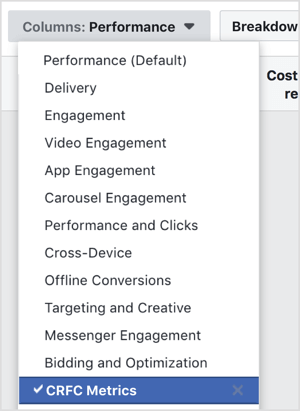
For campaigns that are decreasing in performance due to ad fatigue indicated by a high frequency, you’ll also notice your CPM and cost per result increase. Therefore, your relevance scores will decrease. When you have a campaign that’s improving, however, your frequency will still be increasing, but at a slower rate because you’re reaching more of your target audience due to the high relevance scores. Your CPM will stabilize or decrease slightly, and as a result, your cost per result will also decrease, therefore increasing your result rate and your ROAS. #2: Create a Customized Report in Facebook Ads ManagerTo measure the four core metrics in one reporting view, you want to create a custom reporting column in your Ads Manager dashboard. First, navigate to your Ads Manager dashboard and select Customize Columns in the Columns drop-down menu.
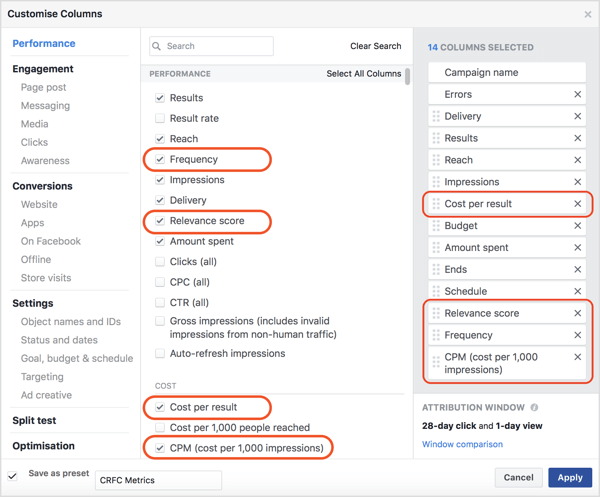
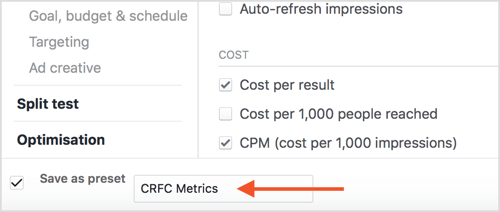
In the Customize Columns window, remove irrelevant columns, and under the Performance section, select the checkboxes to add Relevance Score and Frequency. Then under the Cost category, add CPM.
In the lower-left corner, select the Save as Preset checkbox and name your new column “CRFC Metrics.” Then click Apply to save your changes.
You now have a specific reporting view to use at the ad level of your campaigns. #3: Compare and Analyze Metrics ReportsUse the Compare feature to track changes in these four core metrics to measure the effectiveness of your Facebook ads. By using this feature in your data reporting, you can track how these metrics change over time while your campaigns are running. This gives you insight into how your ads are performing and when to make changes, known as “testing refreshes,” to reduce the impact of ad fatigue. One of the comparison reporting methods you can use is a 7-day running analysis. This is where you compare the CRFC metrics from the last 7 days to the previous 7 days. To use this tactic, navigate to the ad level of a campaign that has been running at least 2 weeks. Once you’re at the ad level, select the CRFC Metrics reporting column you created earlier.
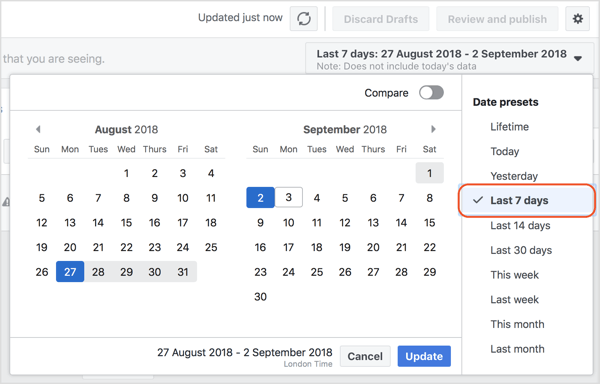
Next, in the reporting view, select Last 7 Days.
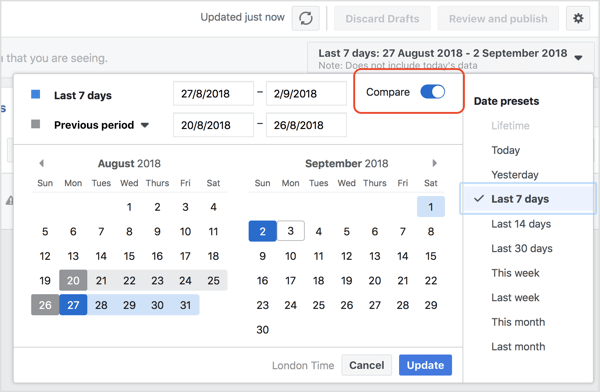
Finally, toggle the Compare switch in the reporting view and the previous period of 7 days will be automatically selected. Click Update.
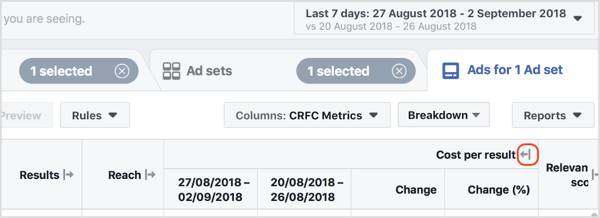
You now see arrows next to the titles of your columns, as shown below. Click on the arrow for a column to see the change (from the first week to the second) in actual numbers for the given metric, as well as the percentage increase or decrease in that metric. Review this data for the Cost per Result, Relevance, Frequency, and CPM columns.
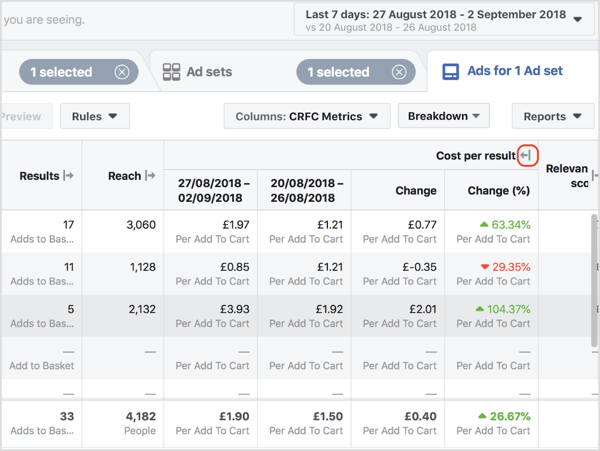
In the example below, you can see that the cost per result — the Add to Cart action — has increased by 26.67% from £1.50 to £1.90. In particular, the first ad in the top row has increased by £0.77, the ad in the second row has decreased by £0.35, and the third ad has increased by £2.01.
By doing this level of analysis on a rolling 7-day basis (comparing the latest week’s data with the previous week), you’ll be able to spot when your campaigns start to decrease in effectiveness due to ad fatigue. Then you can implement testing refreshes to combat the ad fatigue. You’ll also be able to identify the opposite effect, when your campaigns are increasing in performance and you want to find a winning ad to scale. .What do you think? Have you tried doing a 7-day running analysis on your Facebook ads? What changes did you make based on your findings? Please share your thoughts in the comments below.  Social Media via Social Media Examiner https://ift.tt/1LtH18p September 24, 2018 at 05:09AM
0 Comments
Leave a Reply. |
�
Amazing WeightLoss Categories
All
Archives
November 2020
|

 RSS Feed
